
Chemistry
Chapter 1B: Basic Concepts of Chemistry

WebLecture
Scientific Method: The Uses of Experiment
Outline
- The Uses of Experiment
- Analyzing Data
- Practice with Concepts
- Discussion Questions
- Optional Website Reading
The Uses of experiment
Direct experimentation isn't always possible (no astronomer has star stuff in his lab), and even when we can do an experiment, we often make assumptions or simplify the situation in order to make it possible to predict the outcome mathematically. As an experimenter or observer, we need to be sure that we record as much information as possible, and sort out the implications as we become more familiar with the phenomenon under investigation. Assuming that one set of information is irrelevant may lead us to ignore a key factor influencing our experiment.
Another problem with experimenting occurs when we cannot observe a phenomenon directly, but have to infer what happens from direct measurements of related quantities. For example, suppose you want to know the area of a jar lid. You can't measure the area directly; you have to measure the diameter of the lid, calculate the radius r as 1/2 the diameter, and then use the relation A = π * r 2.
The value π is a constant of proportionality. That is, the constant gives you the value of a ratio of variables in a given situation must always have. The area (and circumference, for that matter) of a circle have a particular relationship with the radius of the circle. You can think of it this way: the area of circle and its radius are always some pair of values such that A/r2 = π. The circumference is related to the radius as C/r = 2π.
If you are wrong about how the radius of a circle are related to its area, (suppose you assume that pi = 3), you will get the wrong area. Many experiments we will discuss work the same way: we will measure quantities A and B in order to determine what C should be, and we need to know constants of proportionality with some degree of accuracy, which isn't always easy.
Many of the problems in your text will deal with idealized situations. One of my favorite dynamics problems in college began with the instruction "Assume a perfectly rigid ladder on a frictionless floor, leaning against a frictionless, vertical wall." Of course, there is no perfectly rigid ladder, and even in this age of teflon, no wall is really frictionless. But these simplifications do let us limit the factors in the situation, allow us to do the math (which would otherwise be far more complicated) and get a reasonable estimate for the consequences of sending a mass of exactly two kilograms up the ladder.
These simplified situations are simulations, which today we may be tempted think of only in the context of computers, but which have been used ever since the Ionians as a way of generalizing and simplifying situations. A simulation models the behavior of a real situation by proposing a situation in which every entity is analogous to an entity in the real situation. A good model can become a generally accepted way of thinking about a whole set of events.
As we proceed, we need to ask some questions to make our model as accurate as possible:
- Are all relevant factors (that is, anything which could influence the outcome) represented in the model?
- Are all our assumptions understood and documented?
We always need to remember, however: a simulation is not reality. Physicists can speculate about perfect bridges across a river; engineers have to build in safety "excess" because the materials and conditions they work with are not perfect, and are not always perfectly understood.
Analyzing data
A few notes on units and estimating
[Scientific notation, significant figures and errors in measurements are covered in the next weblecture.]During this course we will need to understand how to use and covert units, estimate answers, use scientific notation, significant figures, and how to determine errors in measurements. Your text goes into these concepts as well, but on the premise that more than one explanation may help, I've put together an example for you.
Let's start by determining the area of a postcard of Portland, Oregon (because it's there).
Units
In the scientific world, the common set of units is the metric system, known by its French name, the Systeme Internationale, or SI system. There are seven base units that measure different physical characteristics or "dimensions":
- Length: meters
- Mass (or amount of matter): kilograms
- Time: seconds
- Temperature: Kelvin (absolute scale)
- Electric Current: ampers
- Amount of substance: moles
- Luminous intensity: candela
All other units are derived units. To determine the units for a given quantity, we use dimensional analysis and look at the different base unit dimensions that are involved. Force measured in Newtons uses a derived unit: a Newton is mass * acceleration = mass * velocity / time = mass * (distance/time)/time. Substituting the SI units for each "dimension", we discover that a Newton is kg * (meters / second) / second or kg * meters/seconds2. Dimensional analysis also helps us determine the right approach to a given problem: we must set the problem up so that the units come out in the terms we require.
Click through the different types of temperature scales to see how they differ.
Units can be converted two ways.
- We may convert a given measurement from one scale to another scale of the same type of measurement, such as converting 1 kilometer to 1000 meters: both are length measurements.
- We may combine derived measures to convert our representation of one amount in units that are more convenient for a given purpose, such as converting from a more familiar unit (say, Fahrenheit for temperature) to SI units such as Celsius. There's an example below for you to work.
We'll also learn how to convert the grams of a substance to the number of molecules of the substance present, a process for which we need to know some conversion factor (in this case, the mole weight of the substance). Don't worry if that doesn't make sense right now, because you'll have lots of practice with this particular conversion as we study stoichiometry!
For now, though, we'll stick to length measurements. Using my handy ruler, which is marked in millimeters and centimeters, I get the length of the long side as 152.1 mm (millimeters), give or take the .1mm. The short side is 101.2 mm, give or take .1mm. Now let's see what we can do with that information in terms of rigorous data analysis.
Actual measurements (cm) |
High possible values |
Low possible values |
15.21 |
15.22 |
15.20 |
* 10.12 |
* 10.13 |
* 10.11 |
152.9252 |
153.6720 |
154.1786 |
Estimating
Rapidly estimating the area, I can conclude that the postcard is roughly 10 cm * 15 cm, or 150 cm2. This is not a wild guess; it is based on rounding real data only enough to make a rapid calculation easier. Any numbers I get by punching into a calculator had better be close to that amount, or I have punched something in incorrectly
Notice also that my dimensions are multiplied as well as the numbers; I started with mm, but I wind up with mm*mm = mm2 (millimeters squared), which are the units appropriate to area. Besides checking that your numbers are in range, always be sure that your units are appropriate to the result. For more information on dimensional analysis, you may want to consult Appendix B in your text.
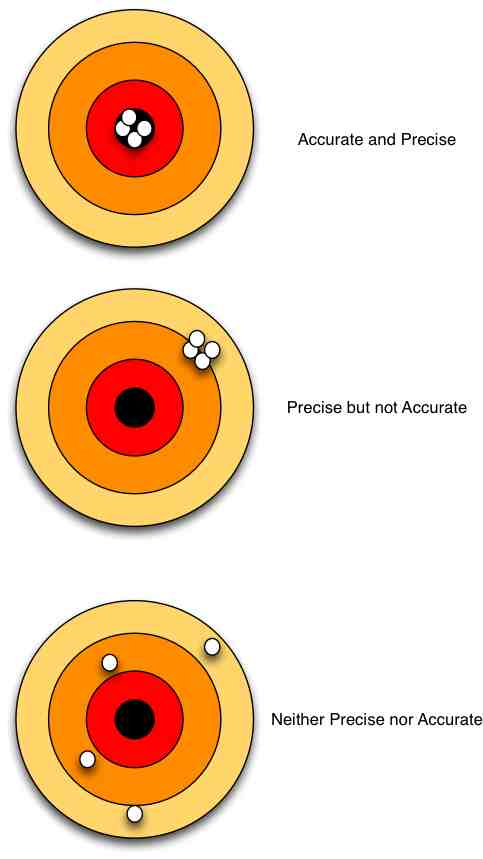
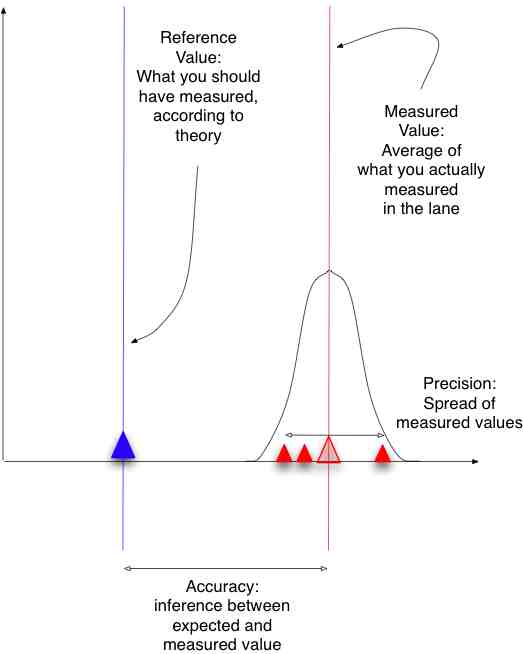
Precision and Accuracy
Modern science experimental methodology distinguishes between precision and accuracy. The diagram on the left shows these concepts applied to a bull's eye score. The diagram on the right shows a mathematical representation of precision (the spread of values) and accuracy (the difference between the measured and expected values).
 |
|
A set of precise but inaccurate measurements may indicate a calibration problem in measurements, or some persistent issue with calculations. Inaccurate measurements or a wide spread of data may indicate sloppy measurement techniques.
Practice with the Concepts
Discussion Questions
- How does a model of a situation differ from the actual situation? What limitations do we need to consider when using models to explain natural phenomena?
Optional Readings
You can learn how the National Institute of Standards and Technology, a division of the US Department of Congress, defines and maintains the official system of units used in the United States.
© 2005 - 2026 This course is offered through Scholars Online, a non-profit organization supporting classical Christian education through online courses. Permission to copy course content (lessons and labs) for personal study is granted to students currently or formerly enrolled in the course through Scholars Online. Reproduction for any other purpose, without the express written consent of the author, is prohibited.