Astronomy
LAB: Observig the sun

Astronomy Lab Instructions
Observing SunSpots
Goal: To use rigorous methods to observe sunspots
Background
If you are reading this lab in order to get data for the differential rotation lab, use the Procedure section only to acquire your data, then return to the differential rotation lab to complete your analysis.
When we make observations of near objects (solar system objects) over time, we must remember that the earth itself is a moving platform. An observer on earth observers a central sunspot on the solar equator at noon on day one. The sun rotates and comes back to this position with respect to a distant star, but in the rotation period, the earth has revolved on its orbit (sidereal period). It takes the sun a few more days to rotate so that the sunspot is again central when the Sun is directly overhead the Earth observer at noon (synodic period).
In calculating the solar rotation period, we must compensate for the earth's motion, and convert our direct observation (synodic period) to the more general situation (sidereal period).
We also need to account for the fact that we observe the solar disk as a flat circle, when of course it is a three-dimensional sphere. We will need to convert our linear measurements of distance on this circle to a rotational measure.
Materials:
- Telescope or binoculars. If you do not have either of these, you can use a pinhole projector. (Solar filters, while providing safe direct viewing, won't let you trace the sunspot positions).
- Tripod or other platform for mounting your observing tool. You should be able to track the sun by adjusting the platform for the few minutes you will need to mark sunspot locations.
- Paper on tablet. You must be able to position the tablet so that the projected image from your observing tool falls on the paper, and you can trace the image of the sun.
- Watch or clock.
- Compass
- Metric ruler graduated in millimeters.
Procedures:
Use the following instructions if it will be clear enough to observe the sun for at least a week at roughly the same time each day:
- Review the instructions at Science at NASA: Safe SunWatching. Pay attention to the safety instructions!
- Set up your equipment so that a focussed image of the sun falls on your paper with at least a 5" diameter. This video below shows a solar image moving across a whiteboard.
- Watch the image for several minutes and note on the paper the direction it moves.
- Readjust the paper and quickly sketch the circumference of the sun.
- Record the date, time of day, and your latitude.
- Readjust the paper so the focussed image of the sun falls in the circle you've just drawn.
- Quick mark the location of any sunspots on the paper.
- Readjust the paper and retain the orientation so the sunspots are properly located, and sketch details around the sunspot.
- Note the time of day when you finished your drawing.
- Repeat the above steps at least four times in the next seven days.
Use the following instructions if weather does not allow you to observe the sun yourself.
- Go to the Big Bear Solar Observatory website.
- In the Data dropdown menu, click on Data Archive, then find the year 2011. Pick a recent month (May or June).
- Pick 7 successive days (e.g., May 17-23).
Observations for each day:- Open the folder for the first day (e.g., May 17): you should see the Magnetogram data for that day. Click on the "Active Region Monitor" link.
- Click on the AIA (4500 angstrom) picture, and print the page off.
Analysis Part I: Observations and Distances
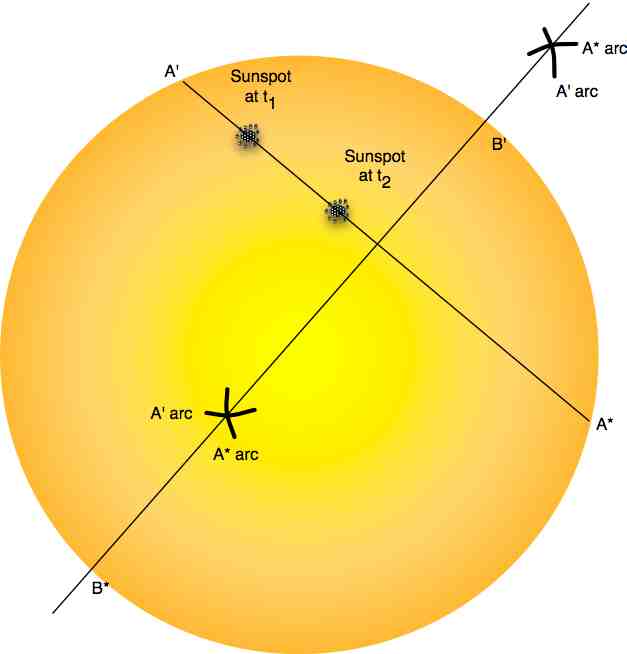
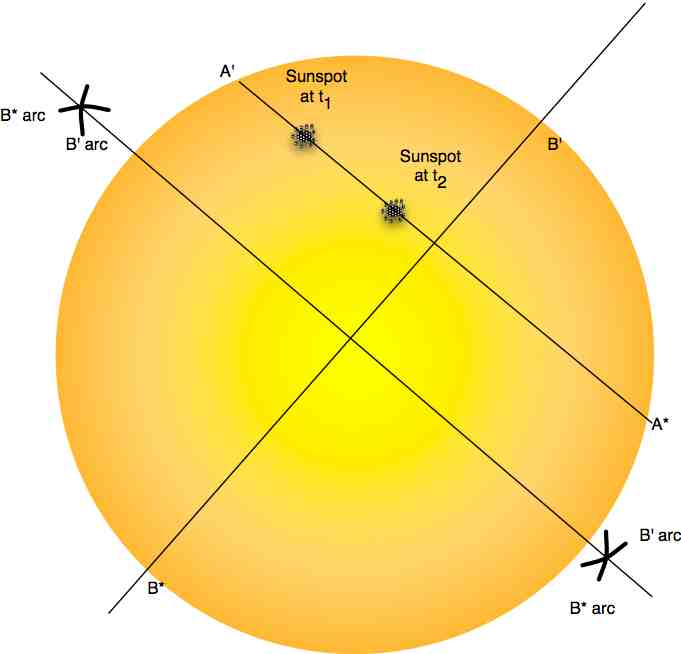
You should now have a series of drawings of the solar disk, with sunspots on them. We need to determine the solar axis of rotation and solar equator from these drawings.
 |
|
 |
|
 |
|
Present your data in table format for at least three pairs of observations t1 and t2.
Analysis Part II: Calculations
Now we have to take into account the fact that the sun is a sphere and not a flat disk. You may want to set up a spreadsheet to do these calculations. You should complete these calculations for at least three sunspot pair observations, so that you can calculate an average value.
- Calculate the elapsed time between your two observations: Δt = t2 - t1.
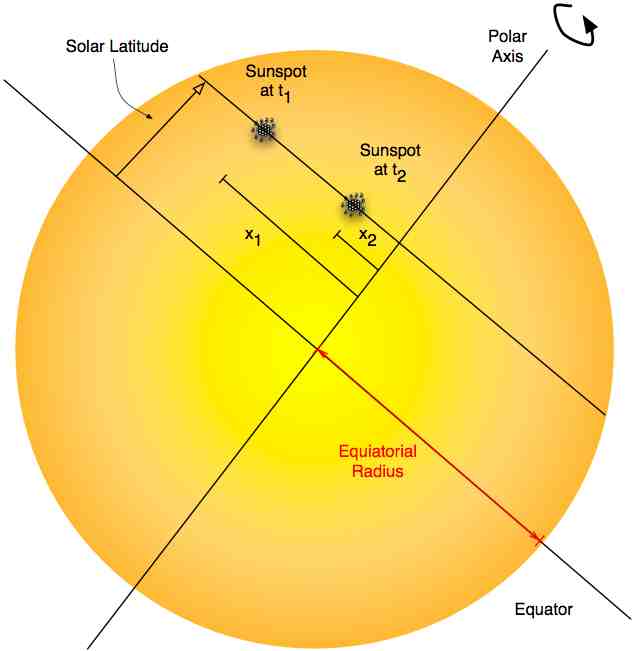
- Calculate the latitude φ from the relationship sin φ = Y/R. (You will need to take the arcsin of sin φ to get the angle φ).
- Calculate the angle θ1 between the rotation radius from each instance of the spot to the line of site to the polar axis: sin θ = x1/√(R2 - Y2);
- Repeat the above calculation to get θ2 for x2.
- Compute the amount of rotation Δθ as |θ2 - θ1|.
- Compute the synodic period of rotation of the sun (S) as S = 360°/Δθ * Δt.
- Compute the sidereal period of rotation of the sun (P) from the relationship P = SPEarth/S+ PEarth. Use PEarth = 365.25 days.
- Average your three calculations for the sidereal period of the rotation of the sun. Estimate your inaccuracy (hours, minutes, days?) and discuss the source of any uncertainty.
- Using Kepler's laws for period and distance from the sun, determine the period for an object in orbit just above the surface of the sun. How does this value compare with your observed value? Why is there a difference?
Report:
Write a standard lab report of and post it to the lab assignment link at the Moodle. It should include:
- A summary of your procedure.
- Organized presentation of your raw data.
- Tables of all measurements.
- Tables of your calculation results, including sample calculations for at least one set of data.
- Your conclusions to the questions in the analytical section.
- Any other observations you think interesting or important.
© 2005 - 2026 This course is offered through Scholars Online, a non-profit organization supporting classical Christian education through online courses. Permission to copy course content (lessons and labs) for personal study is granted to students currently or formerly enrolled in the course through Scholars Online. Reproduction for any other purpose, without the express written consent of the author, is prohibited.